A/B testing lets you show two (or more) versions of a CRO module to different shoppers and see how each version performed. It is found under Growth → A/B Testing.
Uddom reports what happened for each variant, including a statistical comparison. It deliberately does not declare a winner, rank variants or make the decision for you. The judgement is yours.
What you can test#
Not every module can be tested — only ones that can record impressions. The modules available for experiments are:
- Cart drawer cross-sell
- Cart reminder
- Exit-intent offer
- Free shipping & gift bar
- Guarantee banner
- Live viewer count
- Recent sales popup
- Trust badge strip
Creating an experiment#
- Go to Growth → A/B Testing and choose Create experiment.
- Give it an Experiment name.
- Choose the Module you want to test. The first variant is the control: it uses your current configuration, captured from your saved settings the moment the experiment starts.
- Add a second variant, give it a Label and set its Traffic percentage. Choose Configure settings to change the variant’s configuration.
- Check that the traffic totals 100%, then choose Save draft.
Saving creates a draft. Nothing reaches your storefront until you start the experiment.
Variants and traffic#
| Field | What it does |
|---|---|
| Label | Names the variant, for example “Shorter headline”. |
| Traffic | Share of visitors who see this variant, as a percentage. |
| Configure settings | Opens the module’s editor for this variant. Shows how many settings you have changed. |
Add more variants with Add variant. Traffic must add up to 100% before you can save.
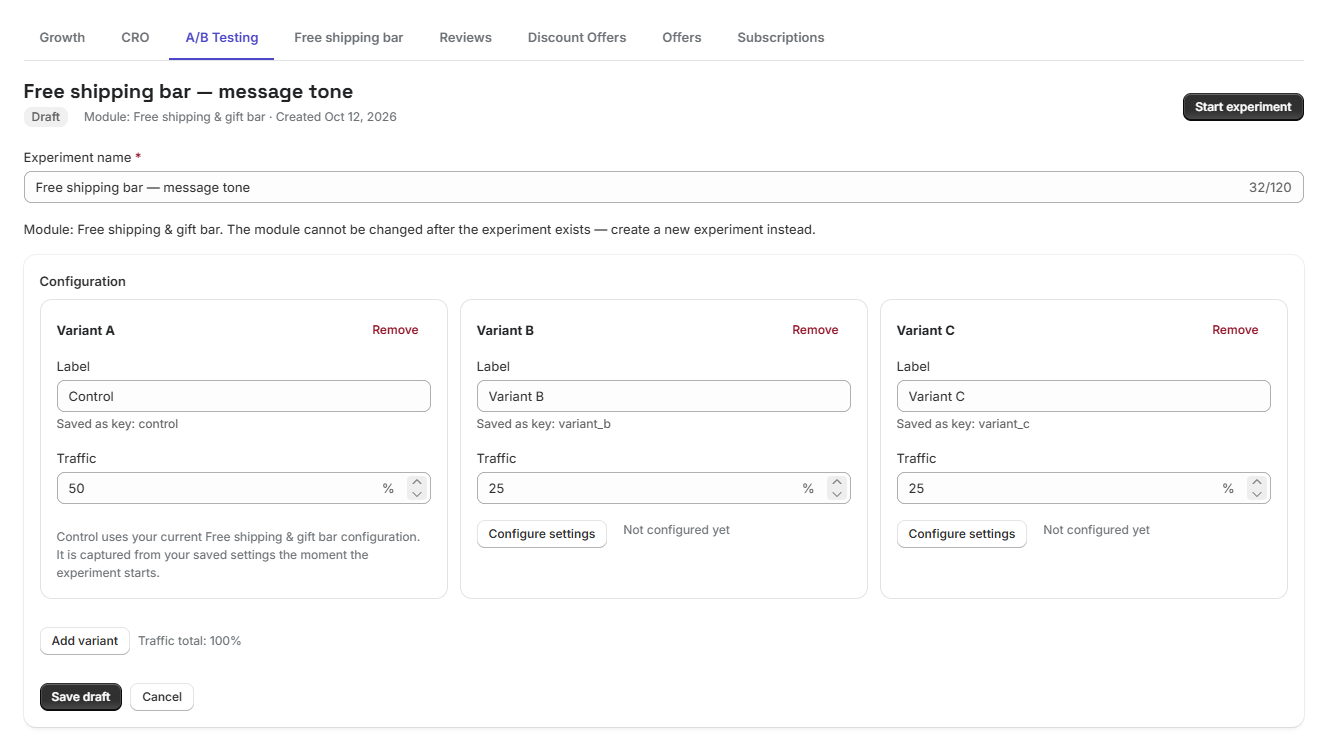 Create A/B test
Running an experiment#
| Status | What it means |
|---|---|
| Draft | Saved but not live. You can delete a draft. |
| Running | Live on your storefront. Its configuration is locked. |
| Paused | Stopped but preserved. Its configuration is locked. |
| Completed | Finished. You can archive it. |
| Archived | Moved out of the way. |
From an experiment you can Start experiment (from draft), Pause and Resume (while running or paused), and Complete to end it. A running or paused experiment cannot be edited — create a new experiment to change it.
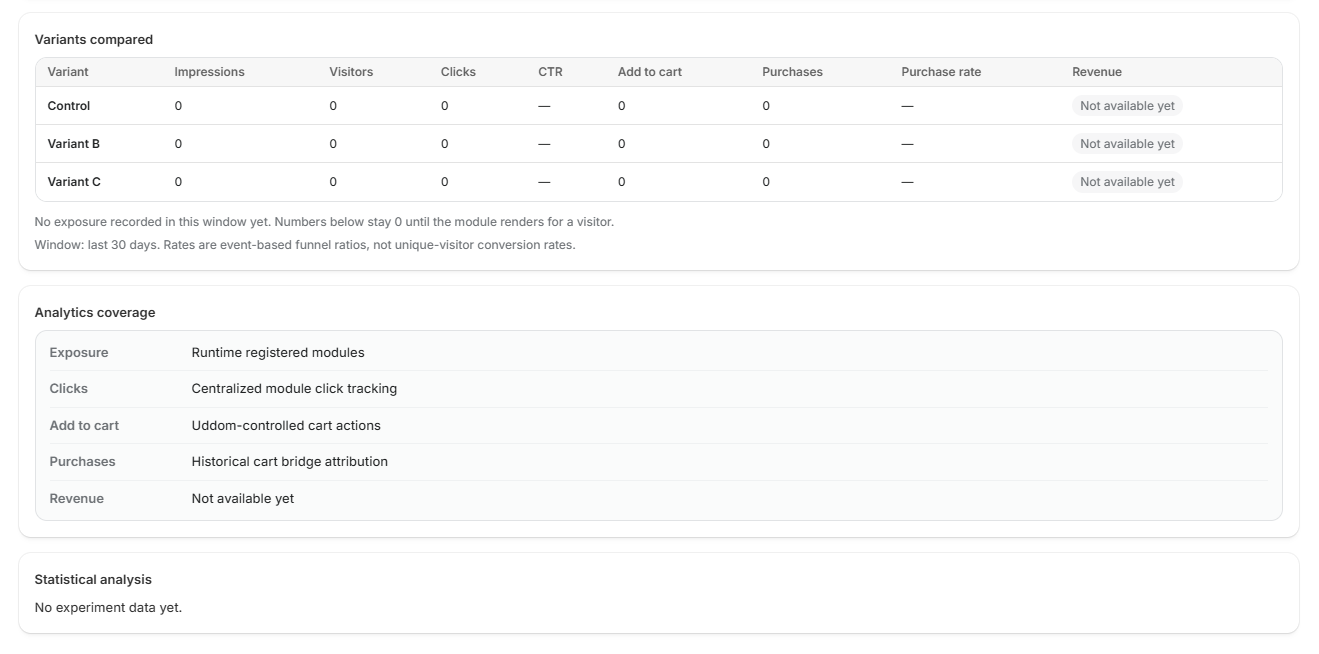 Experiment detail
Reading the results#
Each experiment shows a Variants compared table with impressions, visitors, clicks, CTR, add to cart, purchases and purchase rate. Below it, a Statistical analysis section compares each variant against the control for the visitor click-through rate, with a confidence interval and an adjusted p-value.
| Column | What it shows |
|---|---|
| Visitors | Identified visitors exposed to the variant. |
| Clicking visitors | Visitors who clicked the module. |
| Click rate | Clicks divided by visitors. |
| Difference vs Control | How the variant compares with the control. |
| Relative uplift | The difference as a percentage of the control rate. |
| 95% CI | A confidence interval for the difference. |
| Adjusted p-value | Corrected across the comparisons in this experiment. |
| Statistical result | Whether the difference is statistically significant at the 95% level, or that there is not enough data yet. |
The control row is marked Reference. Where there is not enough data, the result column says so rather than showing a misleading number.
The rates shown are event-based funnel ratios, not unique-visitor conversion rates. Revenue is not currently attribution-reportable for experiments and shows as “Not available yet”.
Best practices#
- Test one change at a time, so you know what caused the difference.
- Give an experiment long enough to collect meaningful traffic before reading much into it.
- Use the confidence interval and p-value together — a small difference with wide uncertainty is not a clear result.
Troubleshooting#
- Traffic will not save. The allocation must total exactly 100%.
- Nothing is recorded. A draft is not live. Start the experiment, and confirm the app embed is enabled.
- The result says “not enough data”. The experiment needs more visitors before the comparison is meaningful.