Insights → Experiments shows the results of your A/B tests in one place.
What it shows#
Each experiment appears as a card with a variant table:
| Column | What it shows |
|---|---|
| Variant | The variant label. |
| Impressions | How often the variant was seen. |
| Unique visitors | Identified visitors exposed to the variant. |
| Clicks | Clicks on the module for that variant. |
| CTR | Clicks divided by impressions. |
| Attributed purchases | Purchases attributed to the variant. |
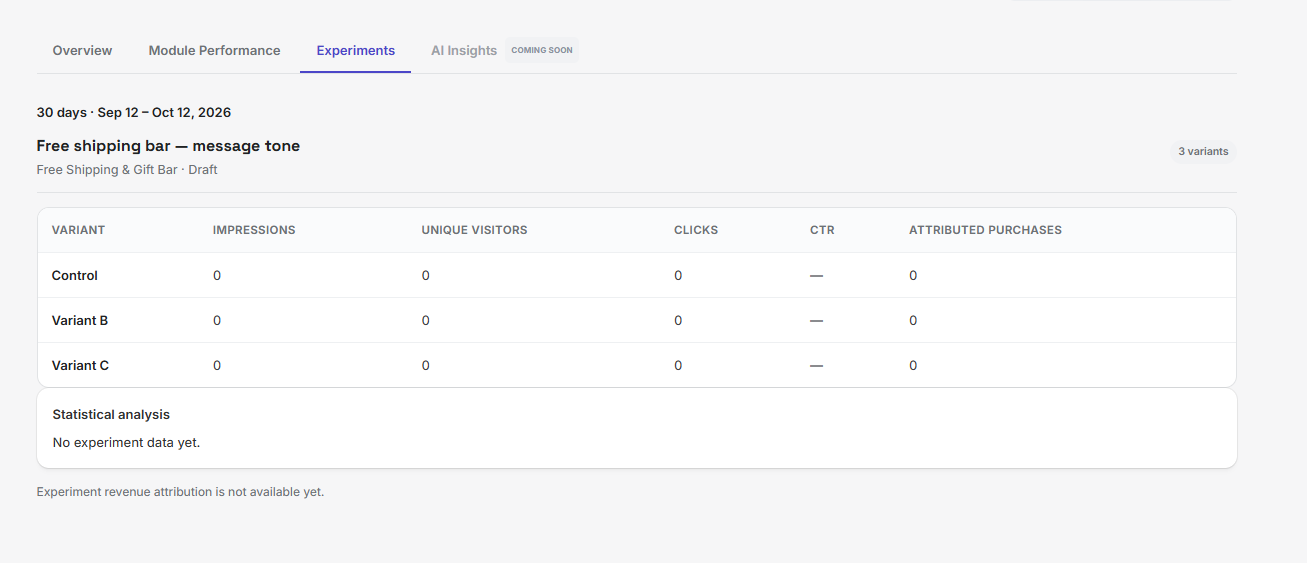 Insights → Experiments
Descriptive statistics#
Experiments reuses the same statistical comparison as the A/B testing detail page: each variant is compared with the control for the visitor click-through rate, with a confidence interval and an adjusted p-value.
Uddom describes the difference and whether it is statistically significant. It does not rank variants, score them, or name a winner. That decision stays with you.
Experiment revenue attribution is not available yet, so revenue is not shown as an experiment result.
Getting there#
- Create and run an experiment under Growth → A/B Testing.
- Let it collect traffic.
- Open Insights → Experiments and read the tables.
Troubleshooting#
- No experiments yet. Create one in A/B testing; the empty state links there.
- The table shows zeros. The experiment may not have recorded exposure yet. Give it time and confirm the app embed is enabled.